Text&Host: Faisal Shehzad
Photo& Video: Echo(徐蕾)
Editor: May(李茹)
>>>About the Speaker:
Prof. Tinghua Ai: Professor of Cartography in School of Resource and Environmental Sciences, Wuhan University; editorial member of journals CEUS, Geomatics and information science of Wuhan University.
His research interests include: map generalization, spatial cognition and spatial analysis.He has published more than 150 papers on the application of computational geometry in map generalization, scale transformation and crowdsourcing spatial data analysis. He led a team to developa map generalization system, which is now widely applied in map production lines in China and plays an important role in the engineering project of Chinese 1:50000 map updating.
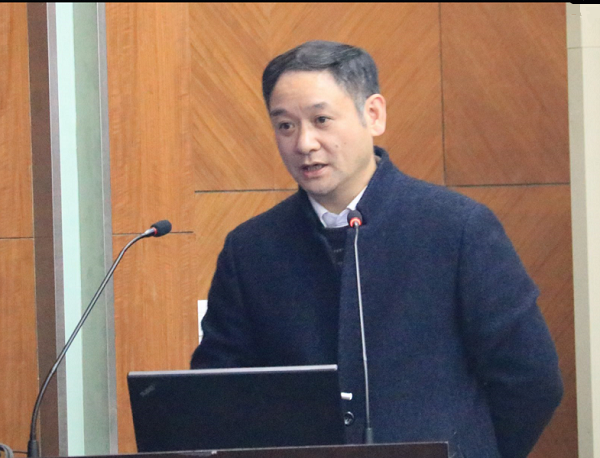
Fig.1 Prof. Tinghua Ai is giving the Talk of EGSC Session.13
>>>About this English Geoscience Café session:
At 19:30, 27thNov, 2017,Prof. Tinghua Ai attended English GeoScience Café No.13 and spoke about Continuous Map Generalization and On-line Service.Kicking off his presentation, Prof. Ai talked about the challenges in traditional cartography map production caused byweb service in Big Data Era, which prompted the transformation of map generalization from offline to online. He outlined the six parts of the presentation: 1) Background: in the era of big data, how to compress data and enhance data by generalization; 2) the concept and methods in online continuous generalization; 3) Prototype system for continuous generalization developed by their team; 4) Progressive transfer of LOD data in web service; 5) Scale transfer of semantic information; and 6)Conclusion.
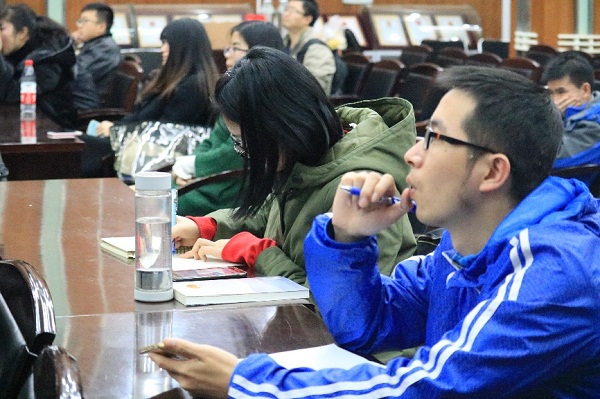
Fig.2 Audience listening to the talk carefully
In the era of Bid Data, we are faced with different kinds of spatial sensing networks. A bulk of crowd sourcing datawithdifferent formats are produced through phone cells, web surfing, check in,GPS trajectory records and so forth (VGI data).All of these crowd source data has brought challenges to data handling, such as the position error in trajectories and the large volume of POI dataand Scribble of OSM.
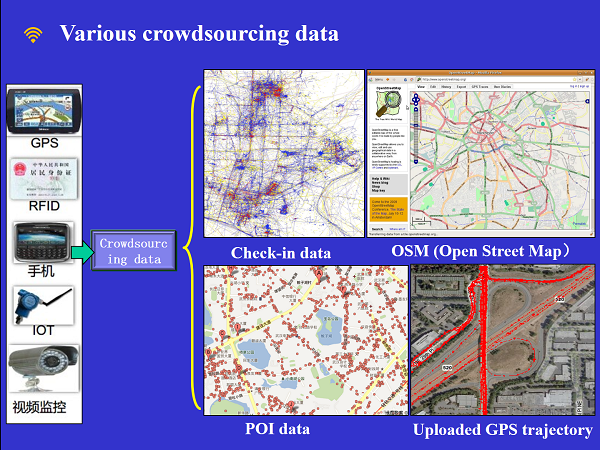
Fig.3 Various crowdsourcing data
According to ICA organization, Map generalization is defined as the selection and simplified representation of details appropriate to the scale and/or the purpose of map. From this definition Map Generalization has twobasic functions: 1)to derive a less detailed map from a more detailed one and 2) toprocess ‘‘information abstraction’’ rather than just ‘‘data compression’’. To serve the purposes of integrating data with different granularity, updating existed map using detailed GPS trajectory line, upload spatial data to PSM and derive the distribution information from POI data, online generalization service is proposed.
Continuous transformation is usually related to LOD (Level of Detail) representation, which is popular in different data objectives such as image fusion, image integration ,2D representation, 3D representation, etc. And here we use it in line features, and it is continuously transforming from coarse to more detailed to realize the representation at different resolution.
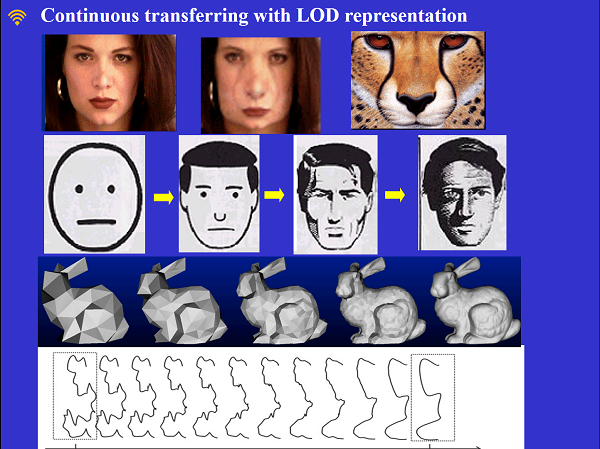
Fig.4 LOD Representation
In the last couple of decades, the VGI services are becoming more and more user oriented. Self-adaptive mapping is becoming more popular day by day. Now users can highlight their context relevant geographical information, change map properties like content, scale, symbology or cartographic method and could output multiple version of maps using same database. All these exciting features have open up new venues in the field of cartography in general and Map Generalization in particular. At the same time, tasks of online generalization service are becoming more and more demanding and more professional expertise are required than ever before.
Later part of the presentation focused onthe technical discussion about online generalization methodology, with three methods available.First, we can select suitable algorithms to develop web services. Many generalization algorithms have been developed in traditional generalization, and we can select the operations with the following properties for online generalization: fast reaction, simple interaction and scale sensitivity. Fig.5 shows the simplification of curve: we use DT to detect the feature point around the curve, and then use the point detection to compute the size of the bend to remove the small bends and reserve the big bends. According to this process, we can get the simplified line.
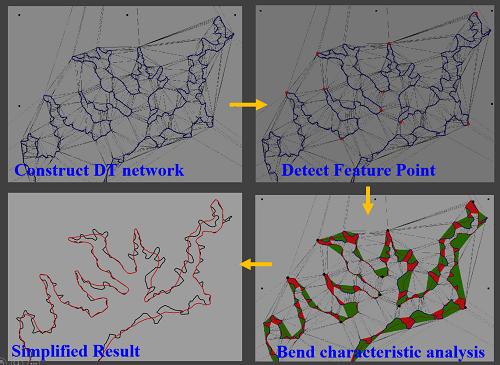
Fig.5 Online generalization operations
The second method is to divide and organize the data by LOD model.According to this model the values of initial representation and changes between consecutive scales are stored independently as follow.
{f(s0),△f1,△f2,△f3,△f4,… }
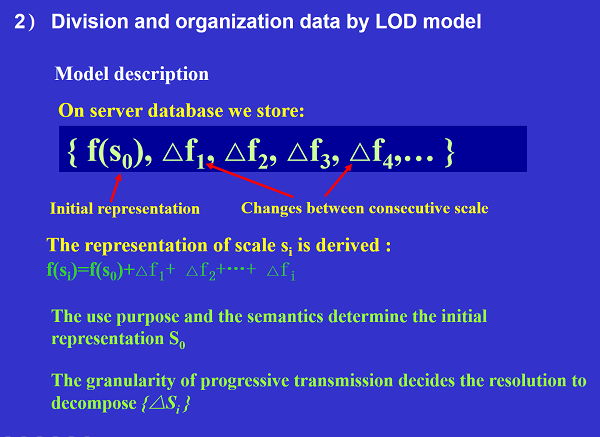
Fig.6 Model description of LOD model
Where f(s0) is the initial representation and△fichange between consecutive scales now we can determine the representation on any scalesiby
f(si)=f(s0)+△f1+△f2+…+△fi
The purpose of generalization and the semantics determine the initial representation S0,whereas granularity of progressive transmission decides the resolution to decompose{△Si}.
There could be a number of Generalization operation applied on any representation but broadly they could be divided into three categories.
? Add(the positive role to make the foreground object. The union in the set operation)
? Subtraction(the negative role to make the background part. The difference in the set operation).
? Replacement
Then, how LOD model could be applied on line and polygon features?Douglas-Peucker algorithm in combination with BLG structure could be used for generalization of line features including all type of network features.
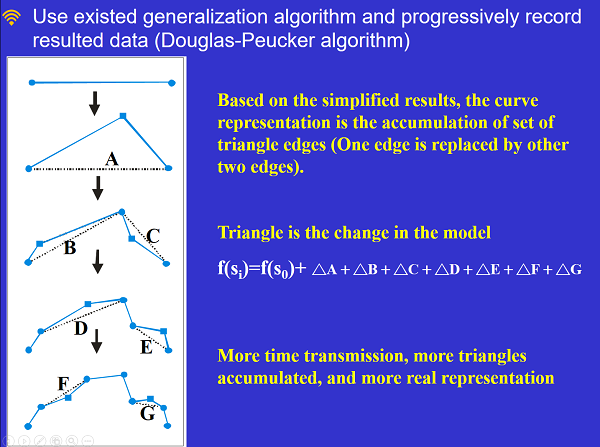
Fig.7 Douglas-Peucker algorithm
1)Polygon features could be divided into two categories; Forirregular polygons like lakes, streams, rivers, islands, etc. they could be decomposed intohierarchical representation of convex-hulls.
2)For regular polygons like buildingetc., MBR is used instead of convex hulls for structural decomposition of these regular shapes.
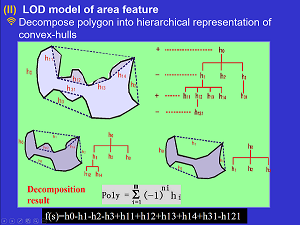
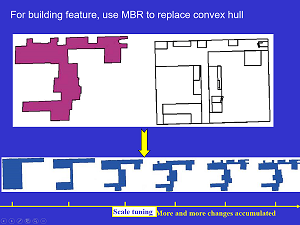
Fig.8 LOD model of area feature
Beside LOD model some other models are also used in parallel to cater the data structure possessing more structural complexity in them, like GAP-tree (Generalized Area Partitioning tree) structure model for polygon cluster features. This model facilitates on the fly generalization, when user will zoom in he will having more detail and detail will disappear as he zooms out gradually. Various models were well elaborated using different application of them.Next Morphing technology is used to derive new representation between two key scale representations and finally a hierarchical web service structure is developed to make the whole system to work in a systematic order.
After elaborating on methodology of online map generalization in great detail, Prof. Ai introduced the prototype system for online generalization developed by him and his team. This system has four major functions, Interaction control, Algorithm selection, Algorithm description and Parameter tuning. This system provides the user to tailor the geographical information according to his requirement using single database in real time. Once the map is generalized the results could be evaluated on the basis of Data reduction rate, Location precision and Topological consistency. In addition to that VGI user could download the data in various geographical data formats.
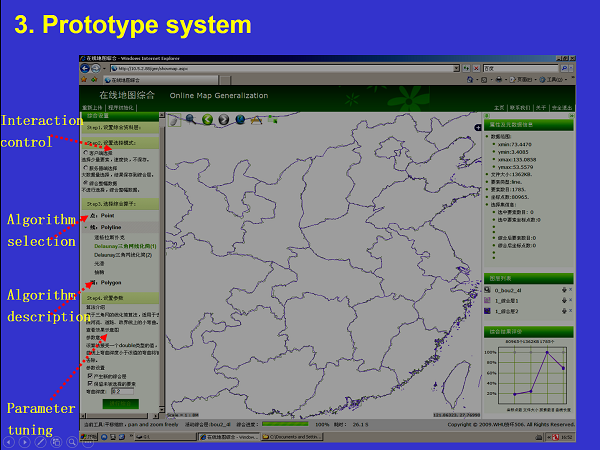
Fig.9 Prototype system interface
Besides spatial data, semantic data also has continuous generalization, and can be represented through Scale transfer. With map viewed as a special spatial language, spatial metaphor can be regarded as an important rhetorical in language representation.Living in physical space, we establish the strong feeling of spatial things. Can we use map-like visualization (contour line, administration polygon inclusion, hydrographic network...) to represent semantic information? The answer is yes and Metaphor map was generated for that purpose.A Metaphor map is a map represents not only the structure,but also thecomponent, relationship, and association in semantic information, itisnatural, aesthetic and also possesses other map artistic characteristics. Here are some of the very interesting Metaphor maps produced by applying generalization concept on semantic information.
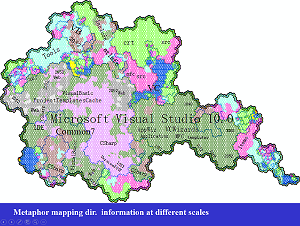
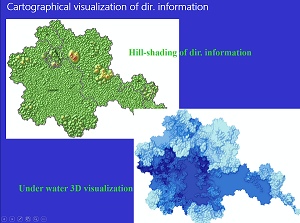
Fig.10 Some amazing Metaphor maps on semantic information
Towards the end of session audience asked a number of questions from the presenter regarding information loss during the generalization process which were answered in great detail. Researchers working in the same study area also seek advice from Prof. for their future work. Session ended with a smiling group photo.
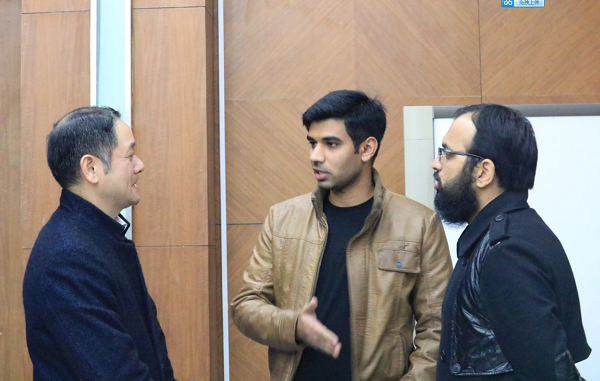
Fig.11 Discussion with Prof.Ai after the talk
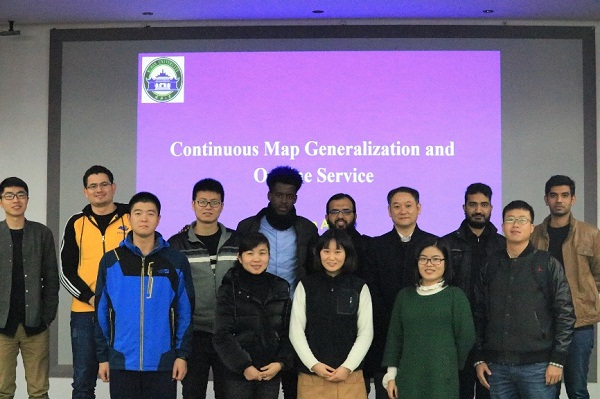
Fig.12 Group Photo of Speaker,EGSC members and Some Audiences
Scan the QR code below and join us!

